The discipline within HR and is sometimes called HR Analytics. In this article, we help you understand what it is and who is likely to use it.
What is the definition of Workforce Analytics?
Workforce analytics refers to the collection of data relating to a workforce and using it to generate actionable insights using data analysis methods so that the performance of an organisation can be improved.

Who uses workforce analytics software?
Organisations that want to do any of the following:
- Improve employee retention
- Improve Employee performance
- Develop compensation plans that work
- Understand employee engagement
- Find the right type of people to recruit
- Develop their employees
Using data mining, benchmarking and other techniques, organisations can uncover insights which can help in all these areas.
Research has shown that organisations that implement data-driven decision-making are more efficient and profitable than their competitors. This includes the use of workforce analytics.
What is the difference between Workforce Analytics and Workforce Management?
Workforce management tools collect a lot of data, including the hours staff actually work and what those hours cost. Analytics is normally an add-on product to a workforce management system that allows an employer to analyse the data generated and make better decisions.
What is the difference between Workforce Analytics and HR Analytics?
We believe they are the same discipline.
What does a workforce analytics tool look like?
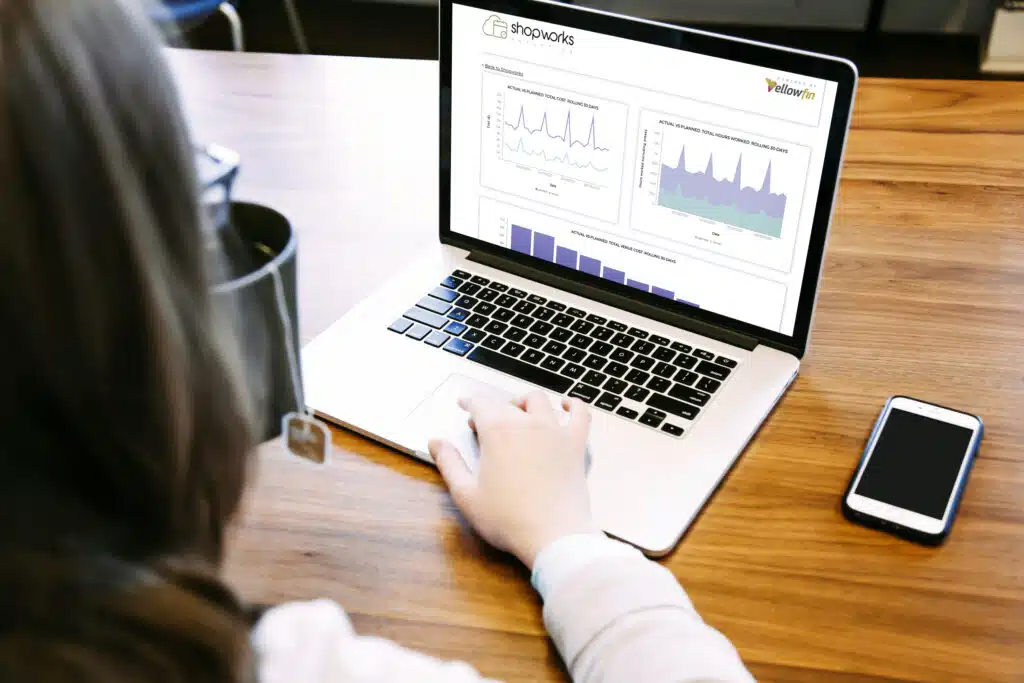
It often looks like a web-based dashboard created in business intelligence (BI) or data visualisation tool. The BI tool can be used for many different purposes and it is only by adding your organisation’s workforce data and creating dashboards of reports and other tools that it becomes a workforce analytics tool.
It will have a number of pre-programmed reports in a visual format, such as graphs and pie charts and can be “drilled down” so that users can interrogate the data, generating new versions of the same visualisation until you end up seeing the raw data for that representation.

Why do you need Workforce Analytics?
Workforce analytics can help HR departments make better decisions about people. If you want to evolve into a data-driven organisation, then workforce analytics is a necessary discipline to introduce to your HR department. The department will benefit from:
- Generating the data to support effective workforce planning.
- Delivering evidence-based HR.
- Develop fair and equitable compensation packages that drive behaviours that meet the organisation’s objectives.
- Understand DE&I issues based on facts.
- Improve recruitment and talent acquisition.
- Improve retention
- Managing employee performance and productivity.
- Highlight skills gaps to support personal development, upskilling and reskilling, which meet the objectives of the organisation.
How does workforce analytics bring value to the organisation?
Workforce analytics can be used to achieve objectives, such as right-sizing, improving employee engagement, supporting diversity, equity and inclusion initiatives and improving talent acquisition and retention. It can also be used to measure individual staff performance, allowing them to be benchmarked against each other and making the focus of training and development easier to target.
Data-Driven HR and Workforce Analytics: The Future of Workforce Planning
As organisations continue to recognise the importance of data-driven decision-making, adopting workforce analytics is expected to increase. This will lead to more companies embracing this technology and methodology to optimise HRM, workforce planning, and overall organisational performance.
The future of workforce planning lies in the integration of workforce analytics with other HR processes, such as talent management, workforce management, performance management, and employee engagement. By leveraging the insights gained from workforce analytics, organisations can make more informed decisions, adapt to changing workforce needs, and ultimately achieve better results.
Related Articles:
How does Workforce Analytics work?
What are the types of Workforce Analytics?


